A Practical Guide to GC Tuning for Core Banking Java Workloads
In a core banking platform running on JBoss EAP, the JVM's garbage collector is one of the most consequential components in the entire stack. It does not show up on architecture diagrams, it rarely appears in vendor SLAs, and yet it directly shapes the tail latency of every transaction — from a balance enquiry on a mobile app to a settlement batch running overnight. Tuning it well is less about chasing benchmarks and more about understanding the workload.
Start with the workload, not the collector
Before changing a single JVM flag, characterise the workload: typical heap occupancy, allocation rate, ratio of short-lived to long-lived objects, peak concurrency, and the latency SLO that actually matters to the business. A retail banking front-end driving thousands of small, short-lived requests behaves nothing like an overnight reconciliation job that allocates large temporary structures. The right collector and the right heap sizing follow from that profile, not from a generic recommendation.
Choosing a collector
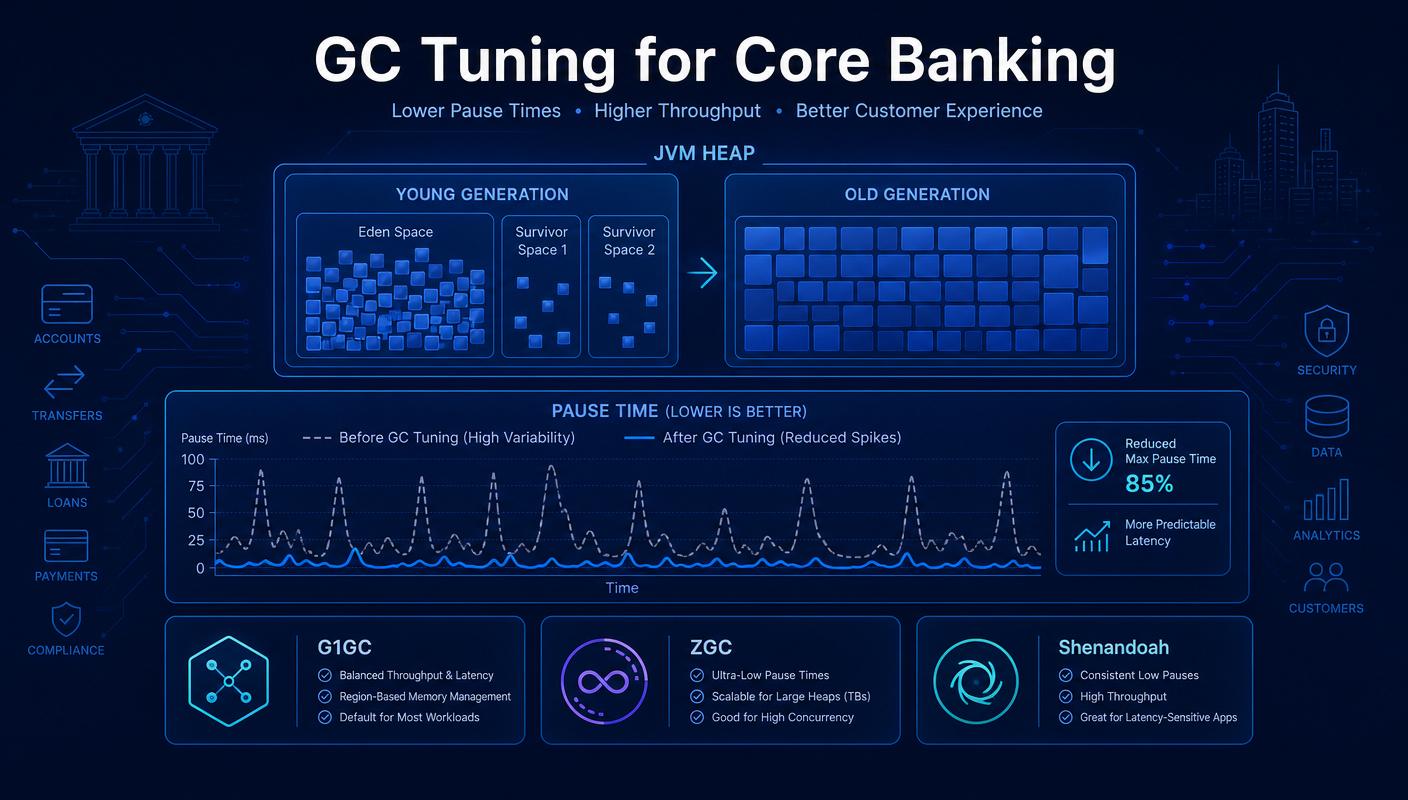
- G1GC remains the safe default for most modern JBoss EAP deployments, with predictable pause times and good throughput for mixed workloads.
- ZGC and Shenandoah become attractive when tail latency is the dominant SLO and heap sizes grow beyond what G1 handles comfortably.
- Parallel GC still has a place for throughput-heavy batch workloads where pause time is less critical than total work done.
Heap sizing is a budget, not a maximum
A common mistake in BFSI environments is treating maximum heap size as a safety margin. In practice, oversized heaps lengthen GC cycles, increase memory pressure on the host, and obscure real memory leaks. Treat heap sizing as a budget tied to the workload's working set, with explicit room for spikes — and revisit it whenever the application profile changes meaningfully.
What good GC observability looks like
Good GC observability is not just a chart of pause durations. It includes allocation rate over time, promotion rate from young to old generation, the distribution of pause times rather than just averages, and a clear correlation between GC behaviour and application-level latency. When an operator can see, in one view, that a latency spike at 11:42 lines up with a Mixed GC cycle following a deployment, root cause analysis collapses from hours to minutes.
Tuning loops that actually work
Effective GC tuning is iterative and evidence-based: measure, hypothesise, change one variable at a time, measure again. Avoid the temptation to apply long lists of flags borrowed from blog posts. Most workloads need only a small number of well-chosen adjustments — collector selection, heap sizing, region or generation sizing, and pause-time targets — combined with rigorous before-and-after measurement.
Where automation helps
Automated GC analysis tools shine when they translate raw JVM telemetry into operator-friendly recommendations: which collector behaviour is anomalous, which heap region is under pressure, which tuning change is most likely to help, and what the expected impact is. The goal is not to remove the engineer from the loop — it is to make the tuning loop short enough that engineers actually run it regularly, instead of only after an incident.